Send post-interaction surveys across voice and digital, design adaptive survey flows in Conversation Studio, and feed results directly into Quality Management to evaluate agent performance.
In-Session Survey Flow
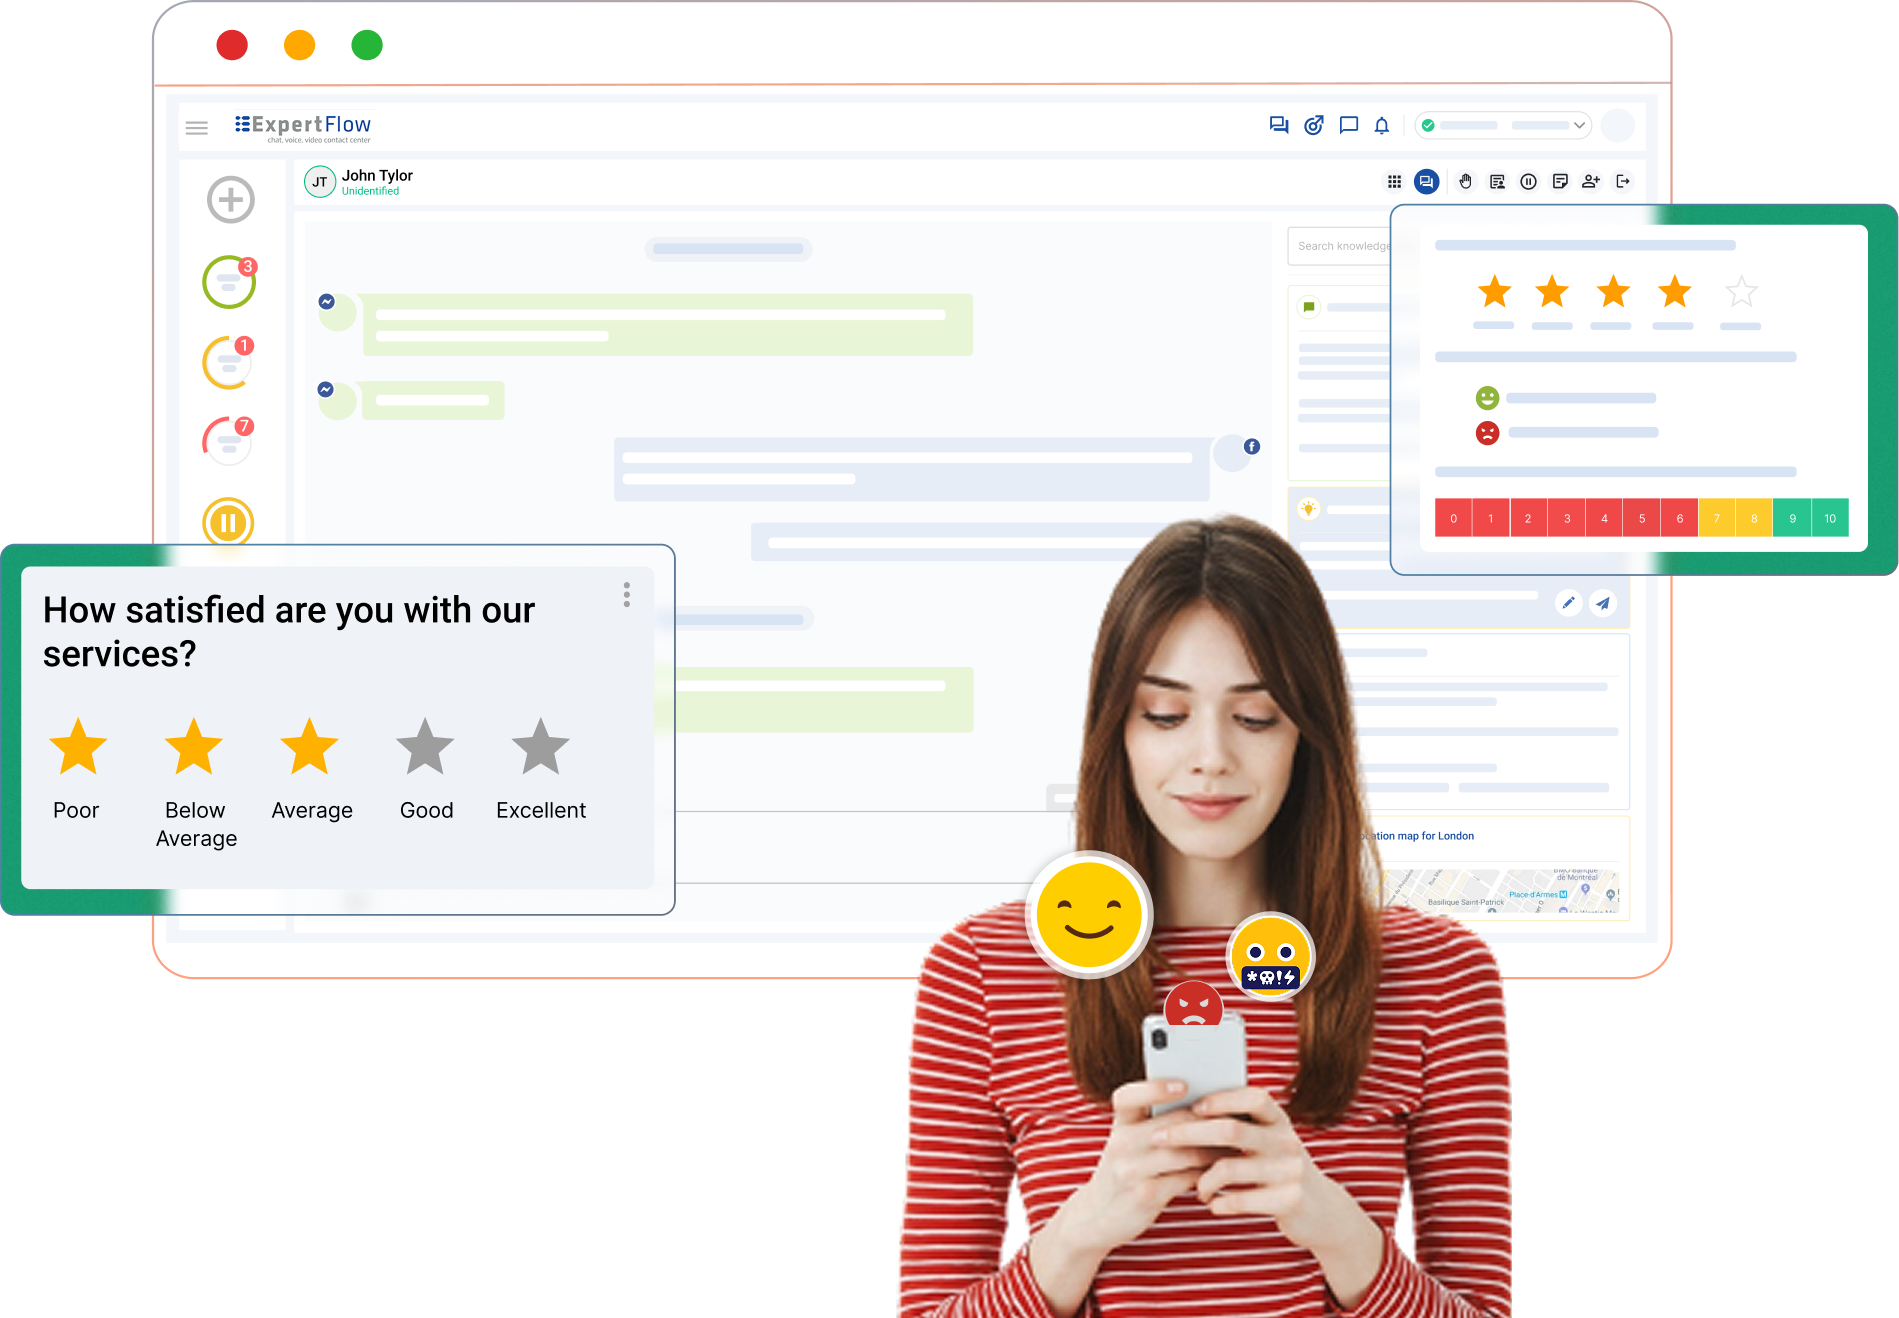
Design and branch surveys inside the live conversation with Conversation Studio—no redirects or post-call forms.
Evaluator-Ready Submissions
Every submitted survey is attached to the interaction and appears in Quality Management for the evaluator’s review.
Studio-Driven Triggers
Trigger surveys from Conversation Studio on events (end-of-call, agent leave, inactivity, SLA) with caps to prevent repeats.
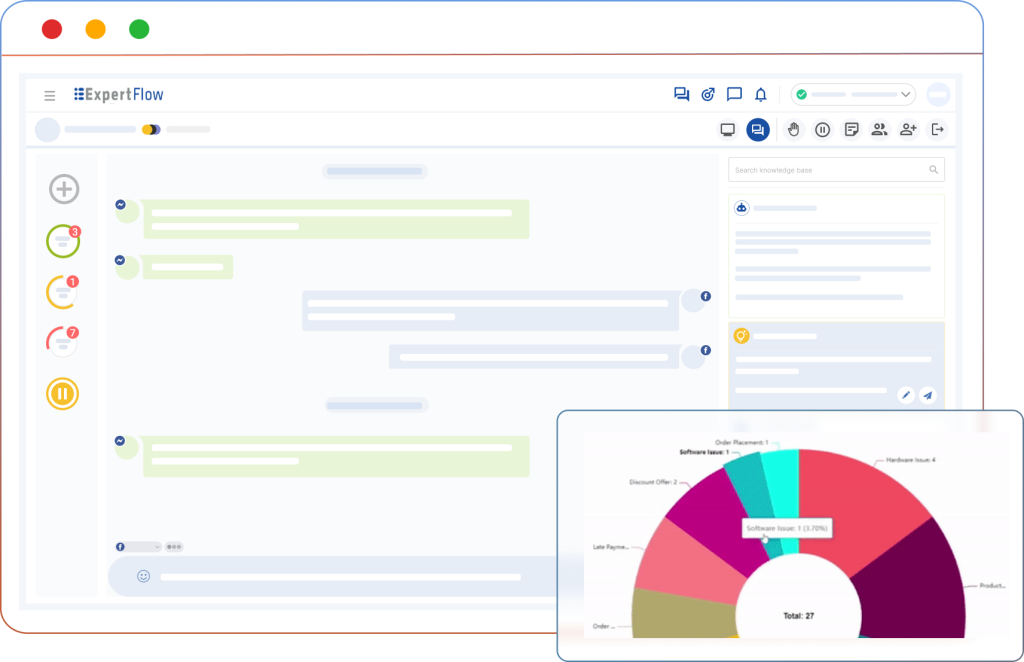
Insights & Analytics
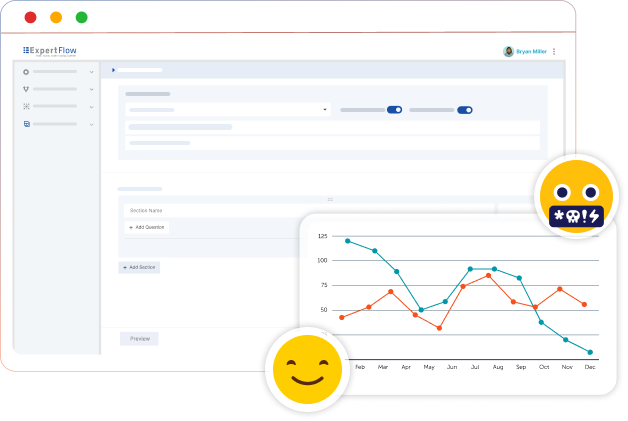
Turn survey results into actionable insights with real-time reports and trend analysis across agents, teams, and channels.
Embedded Survey Builder
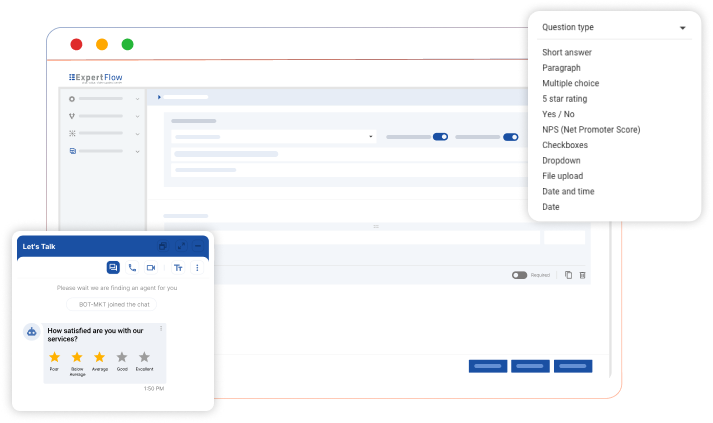
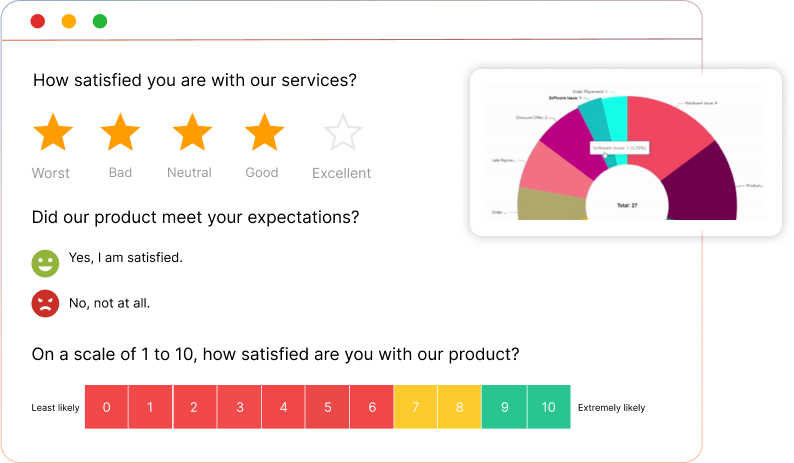
Create logic-driven surveys directly in Conversation Studio. Choose NPS, CSAT, 5-star, MCQ, Yes/No, and open-text; apply branching, validations, and response piping; preview and reuse templates so surveys become part of the dialogue—not an afterthought.
Omnichannel Distribution
Deliver the same survey everywhere: voice (IVR/DTMF or prompts), web chat, WhatsApp, SMS, email, and URL web forms. Send as full forms or as sequential structured messages, scheduled by time zone or journey moment.
Smart Trigger Engine
Use Studio conditions to send surveys precisely—on conversation end, agent exit, inactivity timers, SLA expiry, or scheduled follow-ups. Control frequency with cooldowns, time windows, and per-customer caps to eliminate survey fatigue.
Quality Manager Integration
Submitted surveys are stored with the interaction and surface in Expertflow Quality Management. Evaluators can open the customer’s form alongside recordings/transcripts and factor that feedback into the agent’s review.
Reporting & Real-Time Insights
Track CSAT/NPS trends, response rates, and agent-level metrics in real time. Filter by channel, queue, or timeframe and export results for deeper analysis—so teams can close the loop fast.
Seamless System Integration
Connect via APIs/SDKs to Cisco and the rest of your stack. Manage surveys, triggers, and results from Unified Admin and Conversation Studio, with data written back to the unified interaction history.